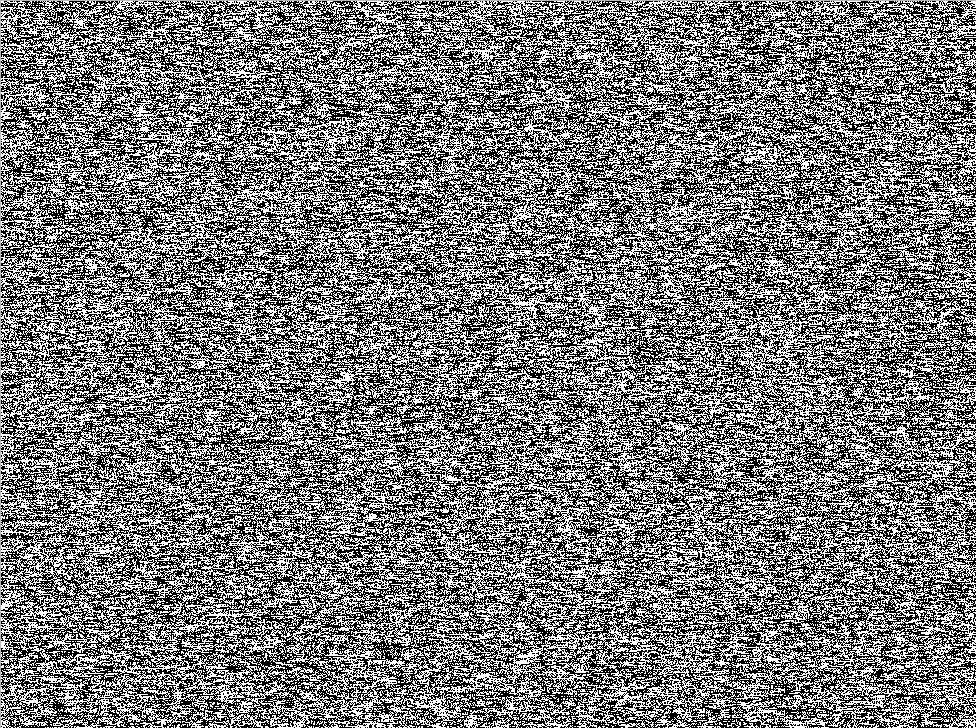
Statistical tests are the best way to measure the quality of generated random numbers, but they’re not the only way. In fact, graphical outputs of random numbers allow people to visually inspect random numbers without relying on statistical outputs. Here, we compare the visual representations of numbers generated using a faulty random number generator, and true random numbers generated by a TL100.
In the following two images, try to see if you can spot any patterns in each image. Each pixel in the images represents one bit of random data, filled from left to right, line by line, from top to bottom.
Picture 1: This first image shows a bitmap graphical representation of numbers generated by a low-quality number generator. Notice that it is easy to observe long continuous horizontal black and white lines, which means that the generated bits are highly biased. Click on the image to view it in full size.
Picture 2: This second image shows a bitmap graphical representation of true random numbers generated by a TL100. In this image, visible patterns are difficult to spot, and it can be argued that there aren’t any. Click on the image to view it in full size.
tl100-trng-good-bitmap
As you can see, there is a clear difference between the two. Whereas the first image from the faulty hardware number generator has noticeable long lines from left to right, the second image from TL100 numbers shows black and white pixels mixed evenly, without any clear pattern.