In this blog post, we attempt to answer the following question:
Can ambient temperature and EMF affect the outcome of SwiftRNG output results?
Overview
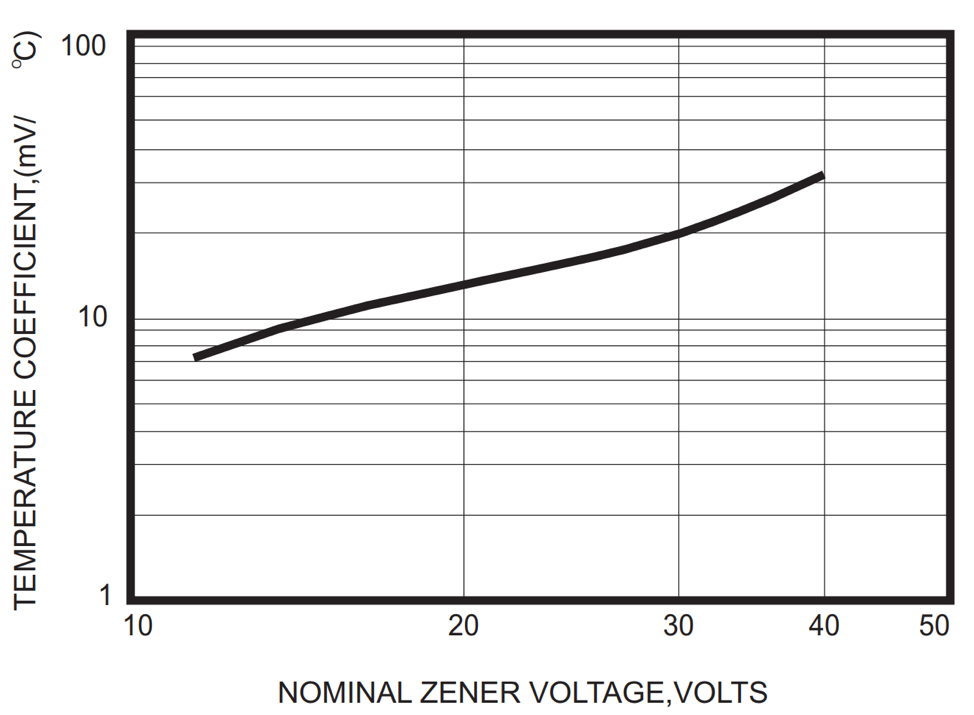
If you pull up technical datasheets of any commercially available Zener diode, you will find, among other technical characteristics, a “Temperature Coefficients” chart. This chart shows the correlation between the nominal Zener voltage and the temperature. We are interested only in Zener diodes with nominal voltages above 5–6 volts, which predominantly use the avalanche breakdown effect. In these Zener diodes, the temperature coefficient is positive. This means that the breakdown voltage will increase once the temperature increases.
In the chart below, we can see that when using Zener diode with nominal voltage of 15 V, the temperature coefficient is approximately 10 mV per degree Celsius. That also means that when the temperature increases by 100 °C (212 °F), the breakdown voltage will increase by 1 V. It is very unlikely that the temperature of the Zener diode used in SwiftRNG will ever increase by 100 °C. If the breakdown voltage increases by 1 V then it won’t deteriorate or make the random noise source less random or decrease the quality of the random output.
To help testing the influence of electromagnetic fields (EMF) on SwiftRNG output quality, we used an AM-10 meter. The acoustimeter AM-10 is a broadband meter that measures the EMF in the range of 200 MHz to 8 GHz. This covers the frequencies used by most modern communication systems in our modern everyday environment.
Experiments
We conducted three experiments to find out how the ambient temperature and EMF can influence the random outcome of Zener-based random noise sources in SwiftRNGs. The same SwiftRNG device was used for all experiments.
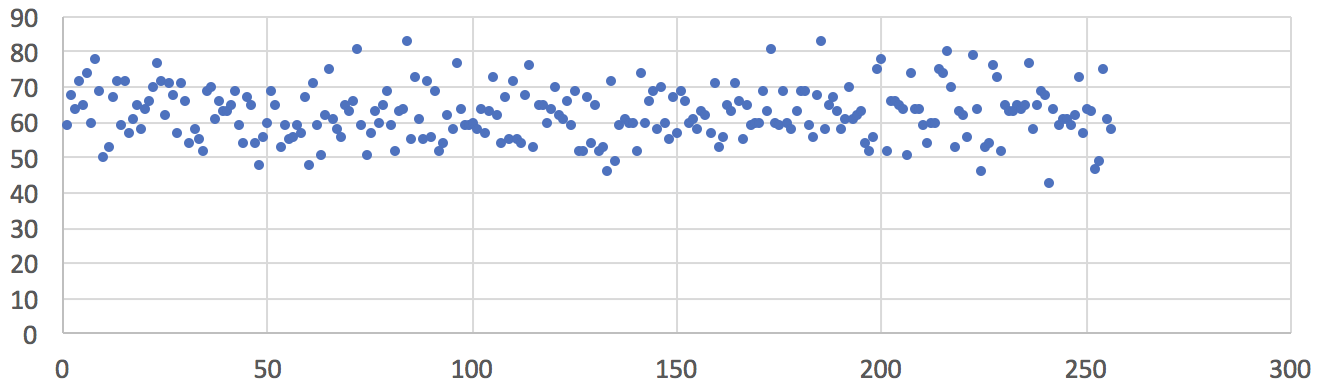
The first experiment was conducted when the ambient temperature was -8 °C (18 °F), the ambient average EMF was less than 1 µW/m², and the peak EMF was less than 0.02 V/m measured with the AM-10 Meter. The only way we could find a place with such low EMF level was by driving to the nearest park, away from streets, offices, and pedestrians that may use cell phones and Bluetooth devices. The chart below shows the uniform frequency distribution of 16,000 sampled random bytes (in the value range of 0 to 255) from a single Zener-based noise source. In addition, we collected 120 MB of raw data output from the SwiftRNG. No evidence of data quality degradation was found when testing this output with the ENT test for randomness.
Fig1: Frequency distribution of 16,000 random values sampled from one noise source. Ambient temperature –8 °C (18 °F), ambient average EMF less than 1 µW/m², peak EMF less than 0.02 V/m. Horizontal axis represents a converted random byte value. Vertical axis represents number of occurrences.
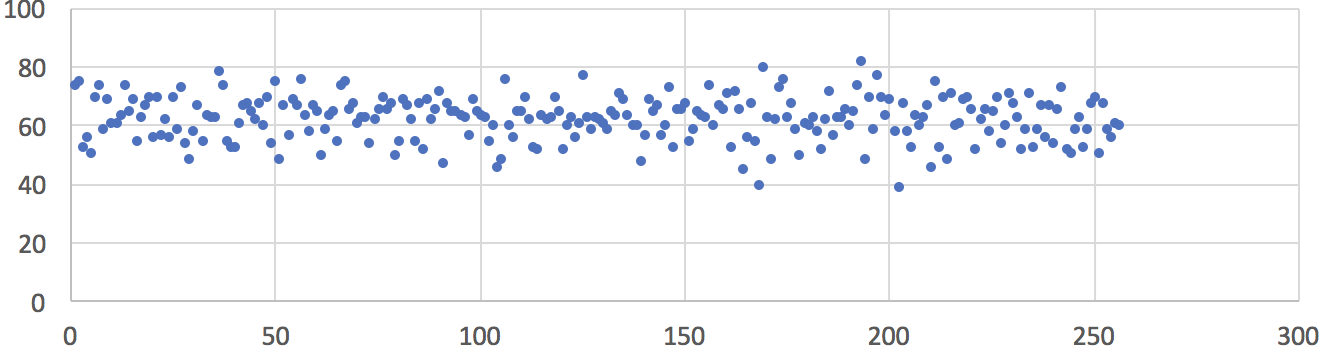
The second experiment was conducted when the ambient temperature was 24 °C (75 °F), the ambient average EMF was less than 1 µW/m² and the peak EMF was less than 0.02 V/m measured with AM-10 Meter. The chart below shows the uniform frequency distribution of 16,000 sampled random bytes (in the value range of 0 to 255) from a single Zener-based noise source. In addition, we collected 120 MB of raw data output from the SwiftRNG and could not detect any evidence of data quality degradation when testing with the ENT test.
Fig2: Frequency distribution of 16,000 random values sampled from one noise source. Ambient temperature 24 °C (75 °F), ambient average EMF less than 1 µW/m², peak EMF less than 0.02 V/m. Horizontal axis represents a converted random byte value. Vertical axis represents number of occurrences.
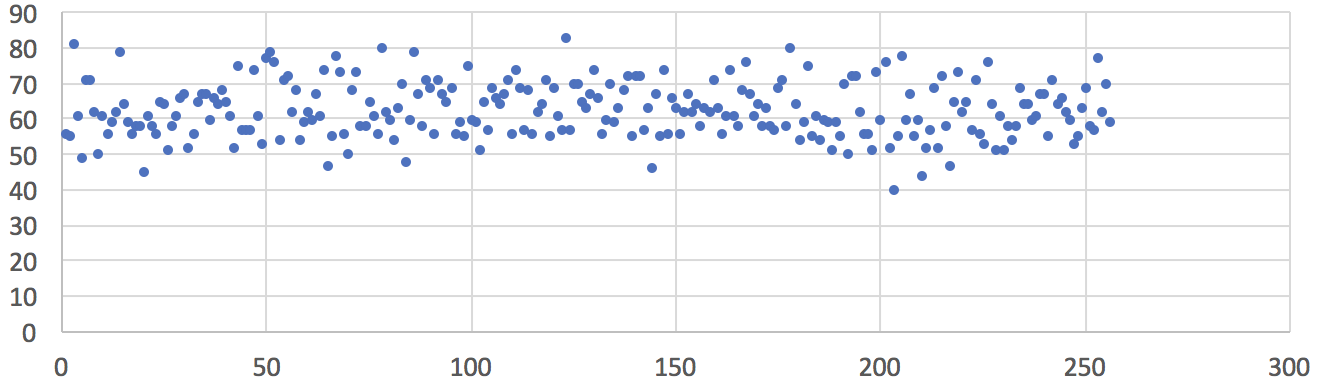
The third experiment was conducted for extreme conditions when the ambient temperature was 28 °C (82 °F), the ambient average EMF was less than 200 µW/m² and the peak EMF was less than 4 V/m measured with AM-10 Meter. Such EMF level can be found in the office in near proximity of WiFi routers or other radio communication devices. The chart below shows the uniform frequency distribution of 16,000 sampled random bytes (in the value range of 0 to 255) from a single Zener-based noise source. In addition, we collected 120MB of raw data output from the SwiftRNG and could not detect any evidence of data quality degradation when testing with the ENT test.
Fig3: Frequency distribution of 16,000 random values sampled from one noise source. Ambient temperature 28 °C (82 °F), ambient average EMF more than 200 µW/m², peak EMF at 4 V/m. Horizontal axis represents a converted random byte value. Vertical axis represents number of occurrences.
Conclusion
Based on our testing conducted with the ENT test for randomness, we did not find any evidence that ambient temperature and EMF can influence the outcome of SwiftRNG random output quality.